flutter_sparkline
Beautiful sparkline charts for Flutter.
Installation
Install the latest version from pub.
Quick Start
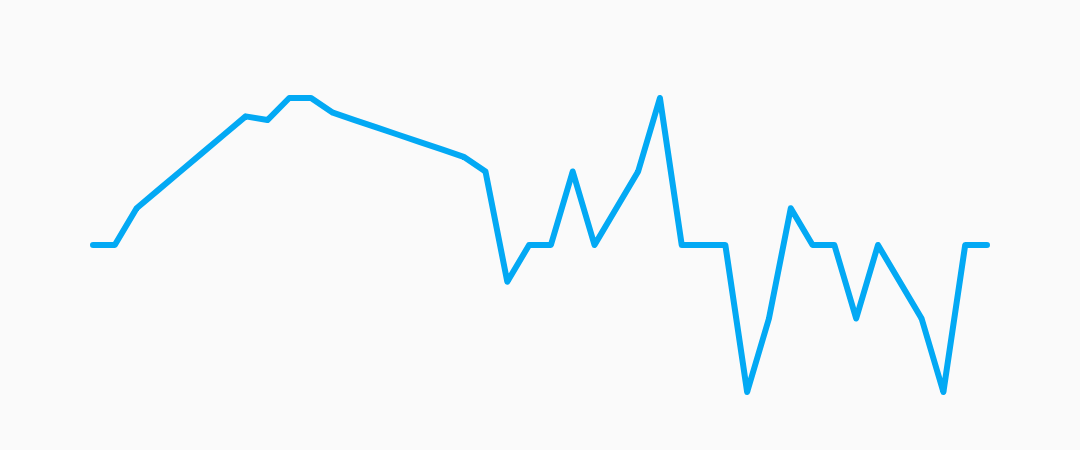
Import the package, create a Sparkline, and pass it your data.
import 'package:flutter/material.dart';
import 'package:flutter_sparkline/flutter_sparkline.dart';

void main() {
  var data = [0.0, 1.0, 1.5, 2.0, 0.0, 0.0, -0.5, -1.0, -0.5, 0.0, 0.0];
  runApp(
    new MaterialApp(
      home: new Scaffold(
        body: new Center(
          child: new Container(
            width: 300.0,
            height: 100.0,
            child: new Sparkline(
              data: data,
            ),
          ),
        ),
      ),
    ),
  );
}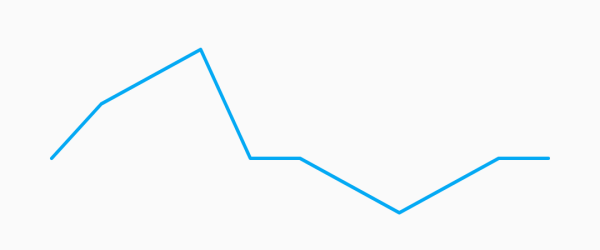
Customization
Sparkline
| Property | Default |
|---|---|
| lineWidth | 2.0 |
| lineColor | Colors.lightBlue |
| lineGradient | null |
Example:
new Sparkline(
  data: data,
  lineWidth: 5.0,
  lineColor: Colors.purple,
);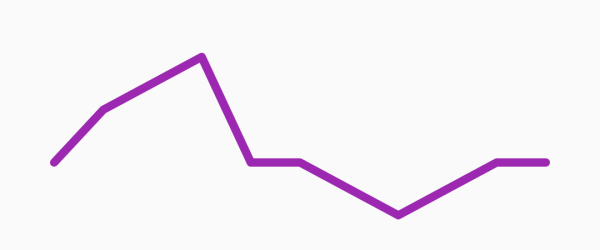
new Sparkline(
  data: data,
  lineWidth: 10.0,
  lineGradient: new LinearGradient(
    begin: Alignment.topCenter,
    end: Alignment.bottomCenter,
    colors: [Colors.purple[800], Colors.purple[200]],
  ),
);
Points
| Property | Default |
|---|---|
| pointsMode | PointsMode.none |
| pointSize | 4.0 |
| pointColor | Colors.lightBlue[800] |
| PointsMode | Description |
|---|---|
| none (default) | Do not draw individual points. |
| all | Draw all the points in the data set. |
| last | Draw only the last point in the data set. |
Example:
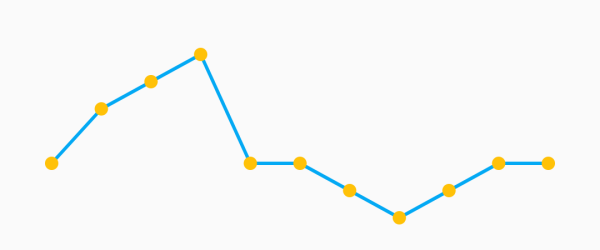
new Sparkline(
  data: data,
  pointsMode: PointsMode.all,
  pointSize: 8.0,
  pointColor: Colors.amber,
);
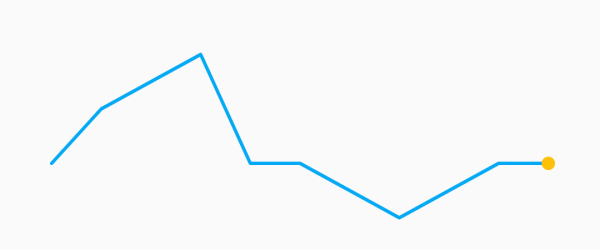
new Sparkline(
  data: data,
  pointsMode: PointsMode.last,
  pointSize: 8.0,
  pointColor: Colors.amber,
);
Fill
| Property | Default |
|---|---|
| fillMode | FillMode.none |
| fillColor | Colors.lightBlue[200] |
| fillGradient | null |
| FillMode | Description |
|---|---|
| none (default) | Do not fill, draw only the sparkline. |
| above | Fill the area above the sparkline. |
| below | Fill the area below the sparkline. |
Example:
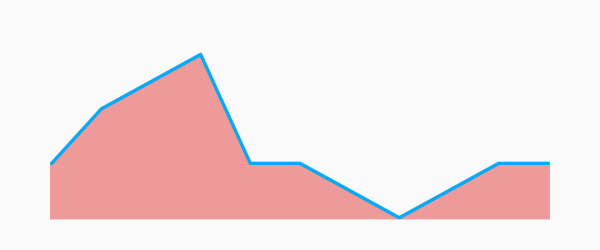
new Sparkline(
  data: data,
  fillMode: FillMode.below,
  fillColor: Colors.red[200],
);
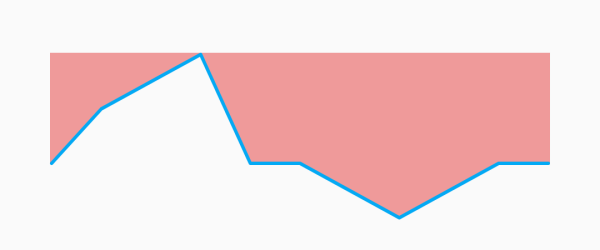
new Sparkline(
  data: data,
  fillMode: FillMode.above,
  fillColor: Colors.red[200],
);
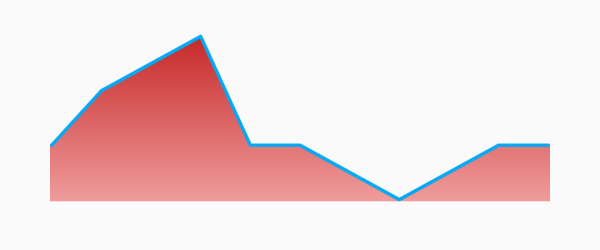
new Sparkline(
  data: data,
  fillMode: FillMode.below,
  fillGradient: new LinearGradient(
    begin: Alignment.topCenter,
    end: Alignment.bottomCenter,
    colors: [Colors.red[800], Colors.red[200]],
  ),
);
Todo:
- [x] simple sparkline
- [x] custom line width
- [x] custom line color
- [x] optional rounded corners
- [x] fill
- [x] embiggen individual points/change color
- [x] different points modes [all/last/none]
- [ ] animate between two sparklines
- [ ] animate drawing a single sparkline
- [ ] gesture detector to select closest point to tap
- [ ] baseline
- [x] different fill modes [above/below/none]
- [x] fix edge points overflowing by offsetting by lineWidth
- [ ] better corner rounding
- [ ] axis labels
- [x] gradient shader on line paint
- [x] gradient shader on fill paint
- [ ] multiple overlapping sparklines on a shared axis
- [ ] tests
Source Code
Please Visit Flutter Sparkline Charts Source Code at GitHub