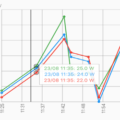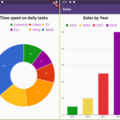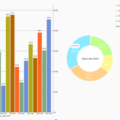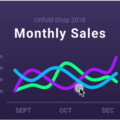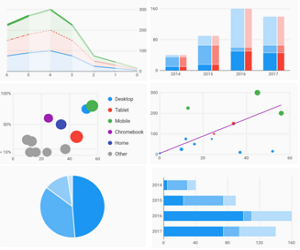
Charts is a general charting library, currently enabled for the Flutter mobile UI framework.
See the online gallery for supported chart types and examples of how to custom components of the chart.
Note: This is not an official Google product.
charts_common
A common library for charting packages.
charts_flutter
A charting package for Flutter, supporting both Android and iOS.
All charts packages are licensed under the Apache 2 license, see the LICENSE and AUTHORS files for details.
Development
This project is developed internally at Google and published for external consumption, external contributions unfortunately cannot be taken at this time.
Gallery
Bar Charts
Time Series Charts
Simple |
End Points Axis |
Confidence Interval |
Line Annotation |
Range Annotation |
Range Annotation Margin |
Symbol Annotation |
With Bar Renderer |
Line Charts
Simple |
Points |
Stacked Area |
Stacked Area Custom Color |
Area And Line |
Simple Nulls |
Stacked Area Nulls |
Dash Pattern |
Segments |
Line Annotation |
Range Annotation |
Range Annotation Margin |
Scatter Plot Charts
Simple |
Shapes |
Comparison Points |
Bucketing Axis |
Combo Charts
Ordinal Bar Line |
Numeric Line Bar |
Numeric Line Point |
Date Time Line Point |
Scatter Plot Line |
Pie Charts
Simple |
Outside Label |
Partial Pie |
Donut |
Auto Label |
Gauge |
Axes
Legends
Simple Series Legend |
Series Legend Options |
Series Legend With Measures |
Legend Custom Symbol |
Default Hidden Series Legend |
Simple Datum Legend |
Datum Legend Options |
Datum Legend With Measures |
Hovercards
| | | | |
| — | — | — | — |
Behaviors
a11y
Domain A11y Explore Bar Chart |
i18n
Rtl Bar Chart |
Rtl Line Chart |
Rtl Line Segments |
Rtl Series Legend |
Source Code
Please Visit Flutter Charint Library Source Code at GitHub


